
Content Writer & SEO Specialist
Content Writer & SEO Specialist
Aditya Sharma is a content writer at OptM Solutions specializing in automotive electronics, embedded systems, telematics, electric vehicle technologies, connected mobility, and autonomous driving technologies.
LinkedIn ProfileWhen a driver accelerates a modern commercial vehicle or electric passenger car, the speedometer needle reacts instantly. To the human eye, this action appears simultaneous. In reality, that seamless physical movement is the result of a highly orchestrated, millisecond-level digital workflow involving mechanical sensors, high-speed network topologies, deterministic real-time operating systems, and vector-graphics rendering engines.
For automotive OEMs and embedded systems engineers, understanding exactly how this data pipeline operates is critical for eliminating frame drops, ensuring functional safety compliance, and managing the thermal limits of the dashboard. This deep-dive engineering guide deconstructs the complete lifecycle of vehicle telemetry—tracing the journey of a single data packet from a physical wheel speed sensor all the way to a rendered pixel on a high-definition dashboard display.
How Does Instrument Cluster Work
An automotive digital instrument cluster works by acting as an edge-processing aggregation hub. It ingests continuous, high-frequency telemetry frames via in-vehicle networks like CAN or Automotive Ethernet. The system's Hardware Abstraction Layer (HAL) decodes these binary payloads and passes the variables to a high-performance System-on-Chip (SoC), where a dedicated graphics engine renders the data into real-time visual UI elements at 60 frames per second.
Before diving into the underlying processing layers, it is essential to establish the baseline of what we are analyzing. If you are new to this architecture, we recommend first reviewing our foundational guide on what is an instrument cluster to understand its broader role in the software-defined vehicle ecosystem.
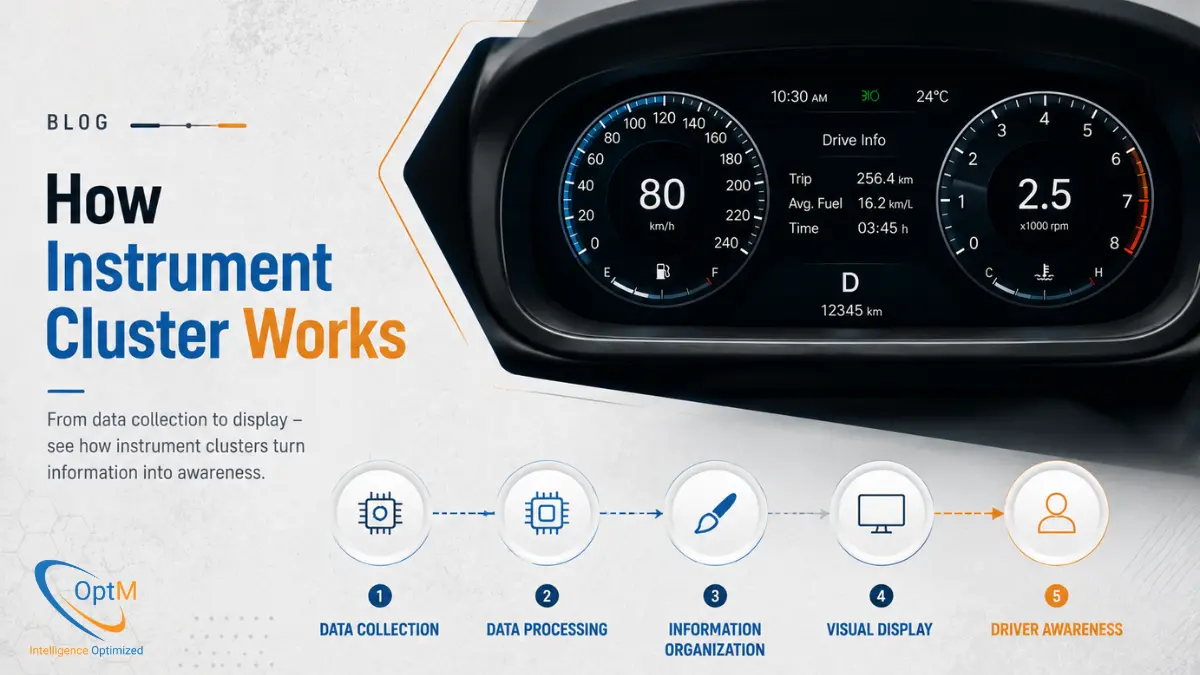
The operational workflow of a cluster is divided into five distinct phases:
- Signal Generation (The Physical Edge)
- Network Transmission (The Bus Layer)
- Protocol Decoding (The Hardware Abstraction Layer)
- Graphic Rendering (The Visual Pipeline)
- Safety Redundancy (The Watchdog Layer)
Phase 1: Signal Generation & The Physical Edge
The cluster does not generate its own data; it visualizes data generated by the vehicle's distributed ecosystem of Electronic Control Units (ECUs). The process begins at the physical layer, where mechanical realities are converted into electrical signals.
Analog-to-Digital Conversion (ADC)
Consider the vehicle's speed. A variable reluctance sensor or Hall-effect sensor mounted near the transmission or wheel hub monitors a toothed reluctor ring. As the wheel spins, the sensor generates an AC voltage or digital square wave proportional to the rotational velocity.
This raw electrical pulse is fed into the local Powertrain Control Module (PCM) or ABS ECU. The ECU's internal microprocessor utilizes an Analog-to-Digital Converter (ADC) to sample this voltage. The ECU then applies predefined mathematical algorithms to convert this raw frequency into a normalized digital metric—for example, 85.5 km/h.
Edge Processing in EVs
In electric vehicle architectures, the telemetry generation is vastly more complex. The Battery Management System (BMS) continuously polls hundreds of individual lithium-ion cells for voltage drops and thermal resistance. It aggregates this data through localized slave-boards before passing a unified State of Charge (SoC) percentage to the primary powertrain ECU.
Phase 2: Network Transmission & The Bus Layer
Once the localized ECU calculates the physical parameter, it must broadcast this data to the rest of the vehicle. This requires robust instrument cluster integration with ECUs, sensors and vehicle networks to ensure data packets do not collide on the wire.
The Controller Area Network (CAN) Protocol
The most common medium for this transmission is the Controller Area Network (CAN) bus, specifically High-Speed CAN running at 500 kbps, or CAN FD (Flexible Data-rate) running up to 5 Mbps for more data-dense payloads.
Instead of sending signals over dedicated point-to-point wires (which would add hundreds of pounds of copper wiring to a vehicle), ECUs broadcast messages onto a shared differential two-wire bus (CAN High and CAN Low).
The Anatomy of a CAN Frame
When the Powertrain ECU broadcasts the vehicle speed, it packages the data into a standard CAN frame consisting of:
- Arbitration ID: A unique identifier that establishes the message's priority. Safety-critical messages (like ABS deployment) receive lower numerical IDs, granting them dominant priority on the bus over infotainment data.
- Data Length Code (DLC): Specifies the number of bytes in the payload.
- Data Field: The actual payload (up to 8 bytes in standard CAN, 64 bytes in CAN FD) containing the hexadecimal representation of the speed.
- Cyclic Redundancy Check (CRC): A checksum used by the receiving node (the instrument cluster) to verify the packet was not corrupted by electromagnetic interference (EMI) during transit.
According to a report by McKinsey & Company, modern connected vehicles process up to 25 gigabytes of data per hour. Managing this throughput requires strict protocol decoding at the hardware level.
Phase 3: Protocol Decoding & The Hardware Abstraction Layer (HAL)
The digital instrument cluster is physically tapped into this shared CAN network via a transceiver. As the electrical voltage differentials hit the cluster's hardware, the true embedded software engineering begins.
The Role of the CAN Transceiver and Controller
To understand the specialized components of instrument cluster hardware, we look first at the transceiver. The transceiver converts the differential voltages (CAN_H and CAN_L) back into a standard digital bitstream (Rx/Tx) that the cluster's microcontroller can read.
The CAN controller then evaluates the Arbitration ID of the incoming message. If the ID matches a predefined acceptance filter (e.g., "I am the dashboard; I need to listen for Speed, RPM, and Engine Temp IDs"), the controller moves the payload into a hardware receive (Rx) buffer and triggers a software interrupt.
The Hardware Abstraction Layer (HAL) and DBC Parsing
Once the payload is in the buffer, the cluster's OS takes over. However, the payload is just a raw string of hexadecimal data. How does the cluster know that 0x55 means 85 km/h?
This is resolved through the Hardware Abstraction Layer (HAL) using a network matrix file, commonly known as a .DBC file. The HAL acts as a translation dictionary. It extracts the raw bits, applies a specific scaling factor, and adds an offset according to the OEM's database.
Mathematical Translation Pipeline:
Physical Value = (Raw Hex Data × Scaling Factor) + Offset
Once translated into a usable floating-point variable, the HAL passes the data securely up to the middleware, bridging the gap between the chaotic physical network and the clean application layer.
Phase 4: Graphic Rendering & The Visual Pipeline
With the telemetry normalized into clean variables, the system must translate those numbers into visual pixels. This requires a robust instrument cluster architecture capable of driving millions of pixels simultaneously without thermal throttling.
The Application Logic
The middleware routes the speed variable to the cluster's main HMI application. If the driver has selected a "Sport Mode" theme, the application logic dictates that the speed should be represented both as a large digital typography asset and a glowing red digital needle mapped to a circular gauge.
GPU Acceleration and The Qt Framework
Automotive embedded systems cannot rely on standard web-rendering technologies due to latency and resource bloat. Instead, they utilize highly optimized C++ based frameworks like Qt and QML.
When building the instrument cluster UI/UX design, engineers program the visual elements as vector graphics rather than static bitmaps.
- State Change: The Qt application receives the new speed value (85 km/h).
- Geometry Calculation: The QML logic calculates the exact degree of rotation required for the virtual needle to point to "85" on the dial.
- Draw Calls: The CPU issues draw calls to the System-on-Chip's (SoC) dedicated Graphics Processing Unit (GPU) via APIs like OpenGL ES or Vulkan.
- Rasterization: The GPU calculates the anti-aliasing, applies shading/lighting to make the needle look three-dimensional, and rasterizes the vector math into a 2D pixel grid.
- Display Output: The rendered frame is pushed to the frame buffer, and the display controller clocks the data out to the TFT-LCD panel via LVDS or MIPI-DSI interfaces.
Engineering Floor Perspective: When dealing with high-resolution Qt HMI development, dropping below 60 frames per second (fps) causes the needle animation to visibly stutter, increasing driver fatigue. To prevent this, our graphics engineers strictly profile CPU-to-GPU memory bandwidth, ensuring texture assets are pre-loaded into the VRAM during the initial boot sequence rather than fetched dynamically during runtime.
Phase 5: The Millisecond Boot Sequence Workflow
One of the most complex operational realities of how an instrument cluster works is how it turns on. Federal Motor Vehicle Safety Standards (FMVSS) mandate that safety-critical telltales (like the brake system warning light) must be fully visible within fractions of a second after the driver turns the ignition key.
A standard consumer tablet takes 15 to 30 seconds to boot its OS. An automotive cluster must achieve cold-boot to early-video in under 500 ms.
The Optimized Boot Sequence:
- Ignition Trigger (T=0 ms): The power management IC (PMIC) detects terminal 15 (ignition) wake-up voltage and supplies stable DC rails to the SoC.
- Hardware Initialization (T=50 ms): The primary bootloader initializes the minimal RAM required and configures the silicon clock speeds.
- Safety Core Wakeup (T=100 ms): The secondary microcontroller (MCU) boots its Real-Time Operating System (RTOS) and instantly illuminates hard-wired LED telltales behind the screen bezel.
- Early Splash Screen (T=300 ms): The primary SoC pushes a static OEM logo (often pre-rendered) directly to the frame buffer, giving the illusion that the system is fully active.
- OS Kernel Loading (T=800 ms): The Embedded Linux or QNX kernel decompresses and mounts the root file system in the background.
- HMI Handover (T=1500 ms): The Qt application takes control of the frame buffer, seamlessly transitioning from the static splash screen to the live dynamic rendering of the gauges.
Phase 6: Safety Mechanisms & The Watchdog Layer
Because the cluster visualizes critical safety data, its operational workflow must include deterministic fail-safes. The cluster cannot simply "freeze." If the primary SoC experiences a memory leak and crashes, the system must recover without blinding the driver to critical vehicle states.
Asymmetric Multi-Processing (AMP)
Modern clusters utilize an AMP architecture. The heavy lifting (3D graphics, navigation mapping) runs on the main SoC (often utilizing an ARM Cortex-A processor). Parallel to this, a simpler, highly robust microcontroller (ARM Cortex-R or Cortex-M) runs a deterministic RTOS.
The Watchdog Timer Mechanism
The safety MCU constantly monitors the health of the main SoC through a software "watchdog timer." The main SoC must send a "heartbeat" signal to the MCU every few milliseconds.
If the SoC's graphics engine freezes, it misses the heartbeat. The MCU immediately detects this failure and executes a hard hardware reset of the SoC. Crucially, during the 1-2 seconds it takes for the SoC to reboot, the MCU takes direct control of an overlay plane on the display panel, maintaining the visibility of critical warning lamps (like ABS or Engine Fault) independently of the crashed graphics engine.
This strict segregation of duties is what allows digital clusters to achieve ASIL (Automotive Safety Integrity Level) compliance under the ISO 26262 standard.
Connecting the Edge to the Enterprise
Understanding how an instrument cluster works reveals a highly sophisticated edge-processing environment. It ingests raw physics, translates it via complex network protocols, and leverages GPU-accelerated graphics to deliver real-time intelligence directly to the driver.
However, in 2026, the data pipeline no longer stops at the dashboard. For OEMs and commercial fleet operators, the localized diagnostics processed by the cluster—such as battery thermal degradation, sustained RPM thresholds, and driver safety alerts—must be aggregated and pushed to the cloud for predictive maintenance and logistics tracking.
If your engineering team is evaluating solutions to bridge in-cabin display rendering with scalable, cloud-connected vehicle architectures, we recommend exploring OptM's production-ready Digital Instrument Cluster solutions.
Frequently Asked Questions
What exactly happens when a digital speedometer needle stutters?
A stuttering needle indicates a bottleneck in the rendering pipeline. This happens if the CPU-to-GPU memory transfer experiences latency or if the graphics engine drops below its locked target of 60 frames per second.
How does a network matrix file (.DBC) convert raw data into screen metrics?
The .DBC file contains pre-defined scaling multipliers and offsets. When raw hexadecimal payload frames travel from the CAN bus to the cluster hardware, the software reads the bits and applies a calculation: Physical Value = (Raw Hex Data × Scaling) + Offset.
What is the processing path of an EV's State of Charge (SoC) before it reaches the screen?
The individual battery cells send localized voltage telemetry to slave circuit boards. The Battery Management System (BMS) aggregates these frames, computes the net SoC percentage, and broadcasts a high-priority CAN frame to the cluster for instant visual rendering.
Why is differential voltage used for network transmission instead of single-wire signals?
Vehicles are highly volatile electromagnetic environments. By running data over a differential two-wire bus (CAN High and CAN Low), any electromagnetic interference corrupts both wires equally, allowing the receiving transceiver to cancel out the noise by measuring only the voltage difference.
What triggers a hardware interrupt inside the cluster controller?
When an incoming message ID matches the cluster's pre-programmed acceptance filters, the physical CAN controller bypasses standard queue sequences to trigger a hardware interrupt, forcing the CPU to process that safety packet immediately.
How does vector-based rendering differ from bitmap rendering on a dashboard?
Bitmap rendering uses heavy, static pictures for every needle angle, which consumes vast memory resources. Vector rendering uses mathematical coordinate data to calculate needle lines and curves dynamically, reducing storage needs and enabling scalable graphics.
What is the maximum data latency permitted for a real-time velocity readout?
To maintain functional safety and provide real-time driver feedback without noticeable lag, the complete pipeline from the physical wheel sensor to the rendered pixel must execute in less than 50 milliseconds.