
Content Writer & SEO Specialist
Content Writer & SEO Specialist
Aditya Sharma is a content writer at OptM Solutions specializing in automotive electronics, embedded systems, telematics, electric vehicle technologies, connected mobility, and autonomous driving technologies.
LinkedIn ProfileIn the architecture of modern software-defined vehicles (SDVs), the driver's dashboard is no longer a passive collection of mechanical dials. It has transformed into a high-performance edge-computing node, responsible for processing millions of lines of code per second to ensure driver safety, situational awareness, and vehicle compliance.
For automotive OEMs, Tier 1 suppliers, and embedded engineers, understanding the core capabilities of this interface is critical when mapping out vehicle network topologies and hardware requirements. This deep-dive engineering guide deconstructs the definitive functions of an automotive digital instrument cluster, explaining not just what data is displayed, but how that telemetry is technically aggregated, prioritized, and rendered in real-time.
What Are the Primary Functions of an Instrument Cluster?
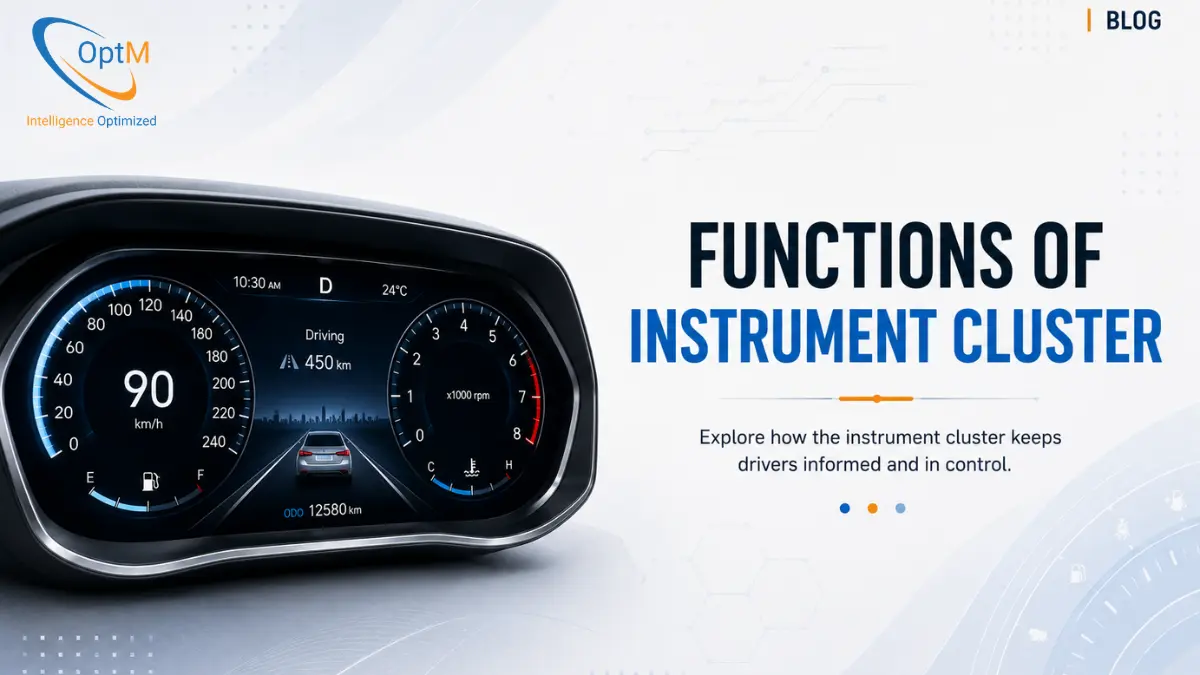
The primary functions of an instrument cluster include visualizing real-time vehicle kinematics, managing safety-critical warning telltales, rendering Advanced Driver Assistance Systems (ADAS) sensor data, and displaying EV battery telemetry. By aggregating high-frequency CAN and J1939 network data, the cluster translates complex ECU diagnostics into immediate, context-aware visual intelligence for the driver.
To fully contextualize these capabilities within the broader vehicle ecosystem, it is highly recommended to first establish a baseline understanding of what is an instrument cluster and how its role has evolved from analog gauges to digital edge nodes.
1. Real-Time Fleet & Vehicle Diagnostics Visualization
The most fundamental operational requirement of the dashboard is the immediate, latency-free display of vehicle kinematics. Unlike consumer electronics, where a dropped frame during video playback is a minor inconvenience, a delayed speedometer readout poses a severe regulatory and safety risk.
Speed and Powertrain Telemetry
The cluster ingests raw rotational data from wheel speed sensors and transmission outputs via the high-speed CAN bus. The embedded software processes these hexadecimal payloads and translates them into fluid visual indicators.
- Speedometer (Velocity): Calculated and rendered with a target latency of less than 50 milliseconds.
- Tachometer (RPM): In internal combustion engine (ICE) or hybrid vehicles, real-time engine revolutions dictate shift timing and fuel efficiency.
Odometer and Trip Analytics
Modern clusters utilize secure, non-volatile embedded memory (such as eMMC) to track lifelong vehicle mileage and localized trip data. This data is cryptographically protected to prevent odometer tampering—a critical requirement for commercial fleet leasing and vehicle resale valuations.
Relying on specialized components of instrument cluster hardware, such as automotive-grade microcontrollers and secure flash memory, ensures this diagnostic data is continuously recorded and visualized without risk of corruption during sudden power losses.
2. Functional Safety and Warning Alerts Management
Beyond basic kinematics, the digital cluster serves as the ultimate visual terminal for vehicle functional safety. It is the primary communication medium between the vehicle's onboard diagnostic systems and the human operator.
Deterministic Telltale Illumination
Federal Motor Vehicle Safety Standards (FMVSS) mandate that specific warning lamps—such as the Check Engine light, ABS failure, and Airbag deployment warnings—must illuminate instantly upon vehicle startup and whenever a critical fault is detected.
To achieve this, the underlying instrument cluster architecture utilizes a deterministic Real-Time Operating System (RTOS). If the braking ECU detects a hydraulic pressure loss, it broadcasts an emergency interrupt frame on the network. The cluster's RTOS preempts all non-critical tasks (like media playback) to instantly render a high-contrast red warning icon.
Watchdog Fallbacks
If the main System-on-Chip (SoC) rendering the digital display suffers a fatal crash, a parallel safety microcontroller immediately takes over. It bypasses the frozen graphics engine to physically illuminate hard-wired LED telltales embedded in the cluster's outer bezel, ensuring the driver is never blinded to critical safety faults.
3. Electric Vehicle (EV) Powertrain and Battery Telemetry
As global automotive production shifts aggressively toward electrification, the functional requirements of the dashboard have fundamentally changed. The cluster is no longer tracking fuel pressure; it is visualizing complex electrochemical states.
According to S&P Global Mobility, global EV sales are projected to command over 40% of total passenger vehicle sales by 2030, fundamentally forcing OEMs to redesign in-cabin interfaces to alleviate "range anxiety."
State of Charge (SoC) and Range Estimation
The cluster interfaces directly with the Battery Management System (BMS) over the CAN bus to display the State of Charge. However, modern clusters go further by utilizing edge-processed algorithms to display dynamic range estimations. These algorithms calculate remaining mileage based on real-time factors such as current HVAC load, battery cell temperature, and historical driving aggression.
Regenerative Braking and Thermal Profiles
- Energy Flow Visualization: The display renders dynamic graphics showing when kinetic energy is being recaptured and fed back into the battery pack during deceleration.
- Thermal Management Alerts: If the EV fast-charging software detects thermal runaway or localized overheating in specific battery cells, the cluster instantly alerts the driver to reduce load or pull over.
4. Advanced Driver Assistance Systems (ADAS) Integration
The integration of ADAS has transformed the cluster from a passive monitoring tool into an active environmental mapping interface.
Sensor Fusion Rendering
Modern vehicles are equipped with external radar, LiDAR, and high-definition optical cameras. The ADAS Domain Controller processes this raw data and sends spatial coordinates to the instrument cluster.
- Lane Keep Assist (LKA): The cluster renders 3D visual boundaries, changing colors (e.g., green to red) if the vehicle drifts over lane markers without a turn signal.
- Adaptive Cruise Control (ACC): Displays the target distance to the leading vehicle, updating dynamically as highway traffic speeds fluctuate.
- Blind Spot and Collision Warnings: Projects immediate, high-priority visual flashes in the driver's direct line of sight when sudden braking is required, reducing reaction times significantly compared to relying solely on center-console infotainment screens.
5. Infotainment, Navigation, and Telematics Convergence
Historically, navigation and media were strictly isolated to the center stack display (Head Unit). Today, minimizing driver distraction requires moving critical navigational context directly into the driver's forward field of view.
Turn-by-Turn Navigation Mapping
High-end clusters utilize Automotive Ethernet to stream heavy, high-resolution map data from the infotainment unit directly to the dashboard. This allows the cluster to render 3D turn-by-turn guidance, lane selection arrows, and real-time traffic density natively alongside the speedometer.
Media and Telematics Metadata
To prevent the driver from looking away from the road to change a song or answer a phone call, the cluster displays localized media metadata (caller ID, track information) in a secondary, non-obtrusive viewing pane.
Engineering Floor Perspective: During a recent architecture optimization workflow for a Tier 1 supplier, our engineering teams noticed that streaming high-density navigation maps over legacy networks caused UI stuttering. The resolution required implementing custom Inter-Process Communication (IPC) memory pooling between the Android Automotive infotainment domain and the cluster's embedded Linux baseline, ensuring 60fps map rendering without overloading the central processor.
6. Dynamic UI/UX Reconfiguration Based on Drive Modes
A critical function of the software-defined dashboard is its ability to contextually adapt. Because the interface is rendered via vector graphics rather than physical plastic, the entire layout can transform based on the vehicle's operational state.
Executing flawless instrument cluster UI/UX design relies on powerful frameworks like Qt and QML. These tools allow the embedded software to dynamically shift the visual hierarchy:
- Eco Mode: The UI prioritizes a green color palette, highlighting regenerative braking metrics and minimizing aggressive tachometer visuals.
- Sport Mode: The layout instantly shifts to high-contrast red typography, enlarging the RPM gauge and displaying performance metrics like G-force or turbo boost pressure.
- Autonomous/Highway Assist Mode: The traditional speedometer shrinks, and the center of the display is replaced by a comprehensive 3D render of the surrounding highway traffic, proving to the driver that the vehicle's sensors are accurately tracking the environment.
Data Prioritization Matrix: How the Cluster Decides What to Show
Because the display real estate is limited, the embedded software must constantly make algorithmic decisions about what information takes precedence.
| Priority Tier | Data Type | Rendering Rule | Example Scenario |
|---|---|---|---|
| Tier 1 (Critical) | ASIL-rated Safety Faults | Preempts all UI elements, renders instantly | ABS failure, Airbag deployment |
| Tier 2 (Operational) | Velocity & Core ADAS | Fixed position, high refresh rate | Speed readout, Lane Keep Assist |
| Tier 3 (Contextual) | Navigation & Battery Logic | Secondary pane, scales based on mode | Turn-by-turn arrows, SoC% |
| Tier 4 (Comfort) | Media & Communications | Minimized during active maneuvering | Caller ID, Radio Station |
Accelerating Production-Grade Cockpit Architectures
The functions of a modern digital dashboard extend far beyond simply displaying speed. By aggregating safety alerts, ADAS sensor fusion, EV battery telemetry, and localized navigation into a single, highly deterministic visual interface, the cluster has become the definitive intelligence hub of the vehicle cabin.
For automotive OEMs and engineering teams, developing a system capable of managing these complex, concurrent functions—while maintaining strict functional safety compliance and 60fps graphical fluidity—requires immense technical bandwidth.
If your organization is navigating the complexities of centralized computing topologies and requires a robust, ARAI-ready foundation for your next vehicle platform, explore OptM's production-ready Digital Instrument Cluster solutions. Our embedded engineering teams deliver end-to-end integration—from Qt-based HMI development and RTOS implementation to physical hardware ruggedization—ensuring your vehicle's most critical data is rendered flawlessly.
Frequently Asked Questions
How does a digital instrument cluster dynamically calculate electric vehicle range estimation?
The system utilizes edge-processed algorithms to track variables beyond basic battery voltage. It aggregates real-time metrics from the climate control loads, ambient air temperature, and historical driving patterns to estimate remaining mileage.
How does the cluster visualize ADAS 'sensor fusion' data?
The ADAS domain controller processes incoming radar, camera, and LiDAR telemetry. It transmits spatial coordinates to the cluster, which renders real-time 3D models of lane boundaries and surrounding vehicle obstacles right in the driver's forward vision field.
Why is an RTOS required to control telltale illumination instead of standard Linux?
Standard Linux uses a time-sharing scheduler that cannot guarantee precise execution deadlines. An RTOS uses strict deterministic scheduling, guaranteeing that an emergency fault indicator will preempt all other processes and render instantly.
How does the cluster manage information hierarchy when multiple warnings trigger simultaneously?
The embedded system evaluates incoming data using a strict arbitration matrix. Red, ASIL-rated critical safety alerts take absolute precedence and override the screen space, pushing lower-priority informational metrics aside.
Can the instrument cluster store odometer records if the main car battery dies completely?
Yes. Odometer metrics are written to secure, non-volatile memory sectors that require no active power to retain data, and these sectors are cryptographically signed to prevent unauthorized mileage manipulation.
What is the main advantage of displaying navigation cues in the cluster versus the center console?
It drastically minimizes the driver's horizontal eye rotation. Moving turn-by-turn vectors directly into the forward line of sight keeps focus tracking closer to the road surface, reducing distraction risks.
What visual modifications occur when switching a vehicle layout into 'Eco Mode'?
The graphics engine shifts the visual interface to emphasize energy efficiency. It prioritizes regeneration indices, scales back dynamic tachometer graphics, and highlights range optimization indicators.