
Content Writer & SEO Specialist
Content Writer & SEO Specialist
Aditya Sharma is a content writer at OptM Solutions specializing in automotive electronics, embedded systems, telematics, electric vehicle technologies, connected mobility, and autonomous driving technologies.
LinkedIn ProfileIn automotive software engineering, writing a computer vision algorithm is only 20% of the battle. The remaining 80% is proving, beyond a shadow of a mathematical doubt, that the algorithm will not fail when a human life depends on it.
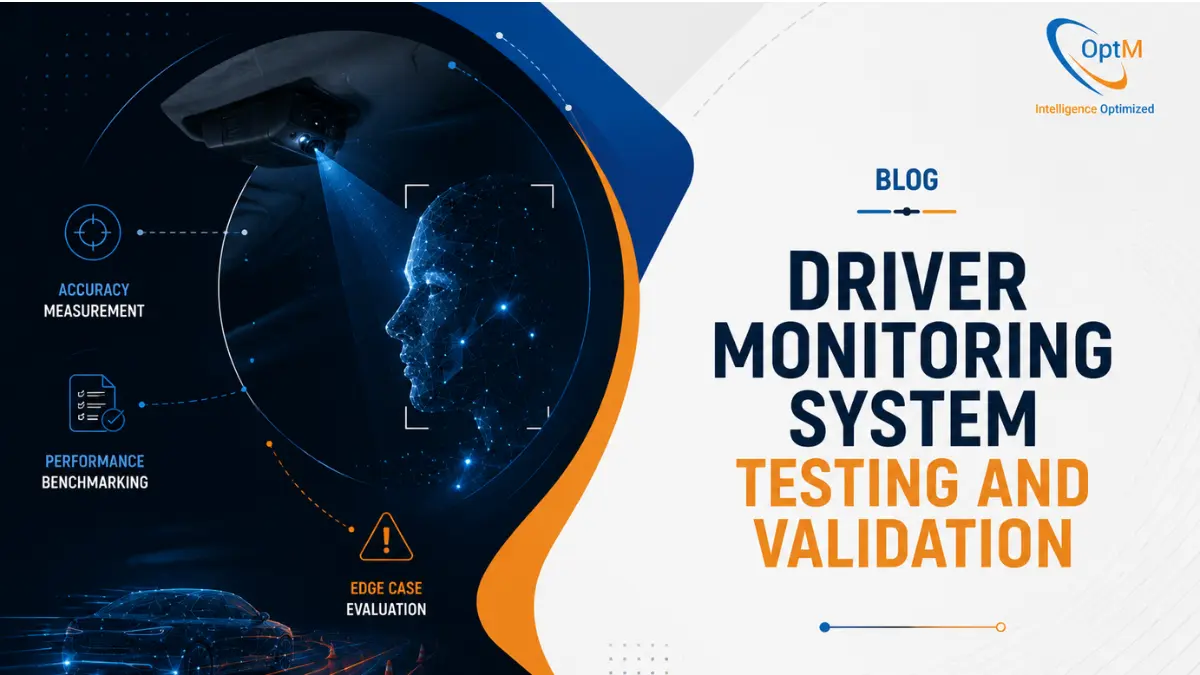
With the European Commission's General Safety Regulation (GSR) and the strict 2026 Euro NCAP protocols mandating Direct Driver Monitoring, the automotive industry is facing a massive validation bottleneck. You cannot simply install a camera, drive a car around a test track for an hour, and declare the system safe.
A production-grade system must survive a brutal, multi-phased gauntlet of software, hardware, and environmental stress tests. If the system incorrectly flags a driver as distracted, you create a nuisance alarm, destroying user trust. If the system fails to detect a micro-sleep, the result is catastrophic.
Whether you are a second-year engineering student trying to understand the V-Model of systems engineering or a Tier 1 architect optimizing a Cockpit Domain Controller, this is your definitive guide to Driver Monitoring System Testing and Validation.
Phase 1: The Ground Truth Data Problem
You cannot test an AI model if you do not know the correct answer. In testing terminology, the "correct answer" is called Ground Truth.
Before a single line of code is loaded onto a vehicle, validation engineers must build massive, highly annotated datasets to serve as the benchmark. If your testing dataset only includes people with light skin, no glasses, and perfect ambient lighting, your validation results are statistically worthless.
Establishing the Ground Truth Baseline
How do you mathematically prove that a driver is looking exactly 15 degrees to the left? You cannot rely on human guesswork.
- The Engineering Example: In a ground-truth calibration lab, test subjects wear specialized headgear covered in active infrared markers. High-fidelity motion capture cameras (similar to those used in Hollywood CGI) track these markers with sub-millimeter precision. Simultaneously, high-speed eye trackers record exact pupil dilation and focal points.
- The Validation Execution: This multi-sensor rig generates the absolute mathematical truth of the driver's head pose and gaze vector. The output of the vehicle's DMS is then compared against this absolute truth. If the DMS calculates a Yaw (head turn) of 12 degrees, but the motion capture rig recorded 15 degrees, the algorithm has a 3-degree error rate.
Understanding this foundational concept of spatial mapping is critical. It is the exact same logic we explored deeply in our guide on What is Driver Monitoring System technology at its core.
Demographic and Edge-Case Matrices
A valid test suite must contain thousands of hours of diverse data. The validation team constructs a matrix that covers:
- Facial Occlusions: N95 masks, thick beards, scarves, and eating/drinking.
- Optical Obstacles: Heavy polarized sunglasses, reading glasses with high glare, and contact lenses.
- Demographics: A wide distribution of skin reflectances (Fitzpatrick scale), eye shapes, and driver heights (from 5th percentile females to 95th percentile males).
Phase 2: Software-in-the-Loop (SIL) and Synthetic Injection
Once the ground truth is established, testing begins in a purely virtual environment. At this stage, the hardware (the camera and the vehicle ECU) does not exist yet.
The SIL Testing Workflow
Software-in-the-Loop (SIL) testing validates the raw logic of the neural networks using a standard desktop workstation or cloud server.
Engineers take the massive dataset of pre-recorded cabin videos and feed them directly into the algorithm. The goal here is to validate the core classification logic of AI and Computer Vision in Driver Monitoring Systems without worrying about processor limits or thermal constraints.
The Role of Synthetic Data
Recording millions of miles of human driving is expensive and dangerous—especially when trying to record drivers genuinely falling asleep at the wheel. To bridge this gap, validation engineers use Synthetic Data Generation.
Using advanced 3D rendering engines (like Unreal Engine), engineers create photorealistic virtual cabins and digital human avatars.
- The Advantage: Engineers can instantly generate a test video of a virtual driver wearing polarized sunglasses, illuminated by a harsh setting sun, experiencing a micro-sleep.
- The Execution: Because the engine generated the avatar, the testing software knows the exact pixel coordinates of the virtual eyelids. This provides a flawless ground truth baseline to test the algorithm's PERCLOS (Percentage of Eye Closure) logic.
Phase 3: Hardware-in-the-Loop (HIL) Validation
SIL testing proves the algorithm works in theory. HIL testing proves it works in reality.
In Hardware-in-the-Loop (HIL) validation, the compiled software is flashed onto the actual production-grade silicon—the exact ECU or System-on-Chip (SoC) that will be installed in the car.
Overcoming the Physical Hardware Bottleneck
Running heavy AI models on a lab computer is easy; running them on an automotive SoC with a strict power budget is a massive engineering hurdle. This is where we confront the core Challenges in Driver Monitoring System Development, particularly thermal throttling and memory bandwidth limits.
The HIL Test Bench Setup
A HIL rig is a complex piece of laboratory equipment designed to trick the ECU into thinking it is driving down a highway.
- Video Injection: Engineers bypass the physical camera lens entirely. Instead, they use a specialized interface board to inject raw, high-definition video data directly into the SoC's MIPI CSI-2 port. The ECU believes it is receiving live data from a camera.
- Network Simulation: The rig connects to the ECU's CAN-FD or Automotive Ethernet ports. It simulates the rest of the vehicle, sending fake speed data, steering angles, and radar telemetry to the ECU.
- Performance Measurement: As the ECU processes the injected video, the HIL rig monitors the processor's vitals:
- Is the CPU maxing out at 99%?
- Is the neural network taking 50 milliseconds to process a frame instead of the required 16 milliseconds?
- Are frames dropping?
The Thermal Chamber Torture Test
Automobiles park in the freezing winters of Norway and the scorching summers of Dubai. To validate hardware resilience, the entire HIL rig is placed inside an environmental testing chamber.
The chamber temperature is cranked to 85°C (185°F). At this temperature, the silicon naturally loses efficiency. If the processor overheats and thermal throttles (slows down to prevent melting), the frame rate might drop from 60fps to 15fps. The validation engineers must prove that even at 15fps, the system can still accurately calculate the mathematical thresholds of How Driver Monitoring Systems Detect Drowsiness and Distraction.
Phase 4: Optical Stress and Environmental Validation
A perfect algorithm running on perfect hardware will still fail if the camera lens is blinded. Phase 4 brings the physical optoelectronic components—the lens, the global shutter sensor, and the Near-Infrared (NIR) LEDs—into the testing loop.
The Lighting Rig Simulator
Engineers place the physical camera module and a human test subject inside a dark room equipped with programmable, high-intensity LED light panels. This rig simulates the optical chaos of the real world.
The Optical Stress Test
| The Optical Stress Test | What is Being Validated? | The Engineering Passing Criteria |
|---|---|---|
| The Tunnel Exit Test | A pitch-black room is instantly flooded with 100,000 lux of light (simulating driving out of a tunnel into midday sun). | The camera's hardware Image Signal Processor (ISP) must adjust auto-exposure within microseconds. The AI must not lose its lock on the facial mesh. |
| The Flickering Shadow Test | Lights are passed over the driver's face rapidly, mimicking the shadows of trees passing over a vehicle at 60 mph. | The global shutter sensor must capture clean frames without motion blur, and the NIR LEDs must maintain steady illumination contrast. |
| The Glare / Reflection Test | High-intensity light is angled directly at the driver's reading glasses to create severe lens glare. | The system's 940nm NIR light must penetrate the visible glare to successfully locate the pupil center and corneal glint. |
Phase 5: Functional Safety and ISO 26262 Fault Injection
Consumer electronics fail gracefully; automotive safety systems must fail predictably. ISO 26262 is the international standard for the functional safety of road vehicles. A DMS typically requires an ASIL B (Automotive Safety Integrity Level) rating.
To validate this, engineers perform Fault Injection Testing. They intentionally break the system to ensure it knows it is broken.
Built-In Self-Test (BIST) Validation
- Hardware Faults: An engineer physically disconnects the NIR LED array from the circuit board while the system is running.
- The Passing Criteria: The system must immediately recognize the voltage drop, register a hardware failure, and broadcast a diagnostic error code across the CAN bus within milliseconds. It cannot simply output "zero distraction" because it is sitting in the dark.
- Software/Occlusion Faults: A test subject places a piece of tape over the camera lens.
- The Passing Criteria: The computer vision algorithm must detect a severe drop in feature confidence. It must flag an "Occlusion State" and notify the driver via the dashboard that the safety loop is compromised.
Validating this exact communication handshake between the camera, the ECU, and the vehicle network is why a rigorously designed Driver Monitoring System Architecture is so critical for production deployments.
Phase 6: Human-Machine Interface (HMI) and Simulator Testing
Detecting a sleepy driver is mathematically useless if the vehicle's warning does not wake them up in time. HMI validation tests the actual human response to the system's output.
The Driving Simulator Environment
Test subjects are placed in a full-motion, six-degree-of-freedom driving simulator. They are asked to perform distracting tasks, like typing a long address into a physical smartphone, while "driving" on a simulated highway.
Validating the Escalation Cascade
Engineers measure how quickly the human corrects their behavior after the system intervenes:
- Visual Warning: Does a soft icon on the dashboard work? (Data shows it rarely does for highly distracted drivers).
- Auditory Warning: The system triggers a sharp, directional audio chime. Engineers measure the driver's physical reaction time (in milliseconds) from the start of the chime to the moment their gaze vector returns to the road.
- Haptic Feedback: If the auditory warning fails, the seat vibrates.
The validation team must tune the exact timing of this cascade. If the warning triggers too early (e.g., after 0.5 seconds of looking away), the driver gets annoyed and disables the system. If it triggers too late (e.g., after 3.0 seconds), the vehicle has already traveled the length of a football field blind. The Euro NCAP standard typically requires visual distraction warnings to trigger between 1.5 to 2.0 seconds of continuous off-road glancing.
Phase 7: Field Operational Tests (FOT)
The final validation stage takes place on public roads. Fleets of instrumented test vehicles—equipped with reference cameras, GPS, and data loggers—are deployed across different global regions.
Engineers drive these vehicles through snowstorms in Sweden, heavy rain in monsoon season, and extreme heat in the American Southwest. This phase validates the entire system integration, ensuring that the sensor fusion between the internal DMS and the external radar (ADAS) functions flawlessly in real-world traffic.
The Core Mathematical KPIs: How OEMs Grade the System
When a Tier 1 supplier delivers a DMS to an automaker, the validation report must prove the system meets strict mathematical Key Performance Indicators (KPIs).
1. Sensitivity (True Positive Rate)
This measures the system's ability to successfully identify an actual distraction or fatigue event.
Sensitivity = True Positives / (True Positives + False Negatives)
Goal: > 95% under all conditions.
2. Specificity (True Negative Rate)
This is arguably the most important metric for user experience. It measures the system's ability to not trigger an alarm when the driver is driving safely. A high specificity means a low false-alarm rate.
Specificity = True Negatives / (True Negatives + False Positives)
3. Gaze Accuracy and Precision
- Accuracy: The average angular difference (in degrees) between the estimated 3D gaze vector and the true ground-truth gaze vector. A production-grade system must maintain an accuracy error of less than +/- 3 degrees to +/- 5 degrees.
- Precision: The stability of the gaze vector. If the driver is staring at a fixed point, the system's output should not jitter or jump around the screen.
4. System Availability
This measures the percentage of time the system is actively tracking the driver during a trip. If the driver is wearing heavy sunglasses and the system loses its lock for 10 minutes of a 60-minute drive, the availability drops to 83.3%. Automakers demand availability rates exceeding 98%.
Frequently Asked Questions
How do engineers test for micro-sleeps without putting real drivers in danger?
Engineers use professional sleep deprivation studies. Test subjects are kept awake for 24+ hours and then placed in a stationary, highly realistic driving simulator. As they naturally succumb to micro-sleeps, the HIL rigs capture genuine, physiological PERCLOS data (slow eyelid closures, rolling pupils) in a zero-risk environment.
What is the difference between MIL, SIL, and HIL?
- MIL (Model-in-the-Loop): Testing the mathematical block diagrams (like MATLAB/Simulink) before any actual code is written. - SIL (Software-in-the-Loop): Testing the compiled C++ or Python code on a standard computer. - HIL (Hardware-in-the-Loop): Testing the final software on the actual physical vehicle processor (ECU) it will be sold with.
Can validation data from a sedan be used for a commercial truck?
No. The spatial geometry is completely different. A truck driver sits much higher, the steering wheel angle is flatter, and the camera placement is further away. The system must be re-calibrated and re-validated using a specific 3D spatial matrix tailored exclusively to the commercial vehicle cabin.
How does Euro NCAP validation differ from standard OEM testing?
OEM testing ensures the product works. Euro NCAP testing is a standardized, public grading system. Euro NCAP uses highly specific, rigid test scenarios—such as a driver holding a phone at a specific angle for a specific number of seconds. Failing the Euro NCAP validation matrix directly impacts the vehicle's public safety star rating, severely hurting market sales.
Accelerate Your Validation Lifecycle
The path from an algorithm on a computer screen to a fully validated, ASIL-compliant, factory-ready automotive platform is littered with hardware bottlenecks and optical edge cases. Accelerating this lifecycle requires deep expertise in HIL simulation, thermal optimization, and rigid ISO 26262 compliance tracking.
Explore how our embedded systems engineering teams can streamline your validation processes, eliminate false positives, and ensure seamless integration with broader vehicle networks. Review our production-ready Driver Monitoring System solutions today to elevate your intelligent cabin architecture.